MySQL Workbench: Performance
MySQL Workbench includes various tools for both DBAs and Developers related to viewing and improving performance. The Performance Dashboard and reports allow DBAs to easily view overall server performance, and various reports provide views of IO hotspots, SQL statements, Network, Data Engine, and more. For developers, MySQL Workbench provides easy to understand views into optimizing queries and data access.
New! Performance Dashboard
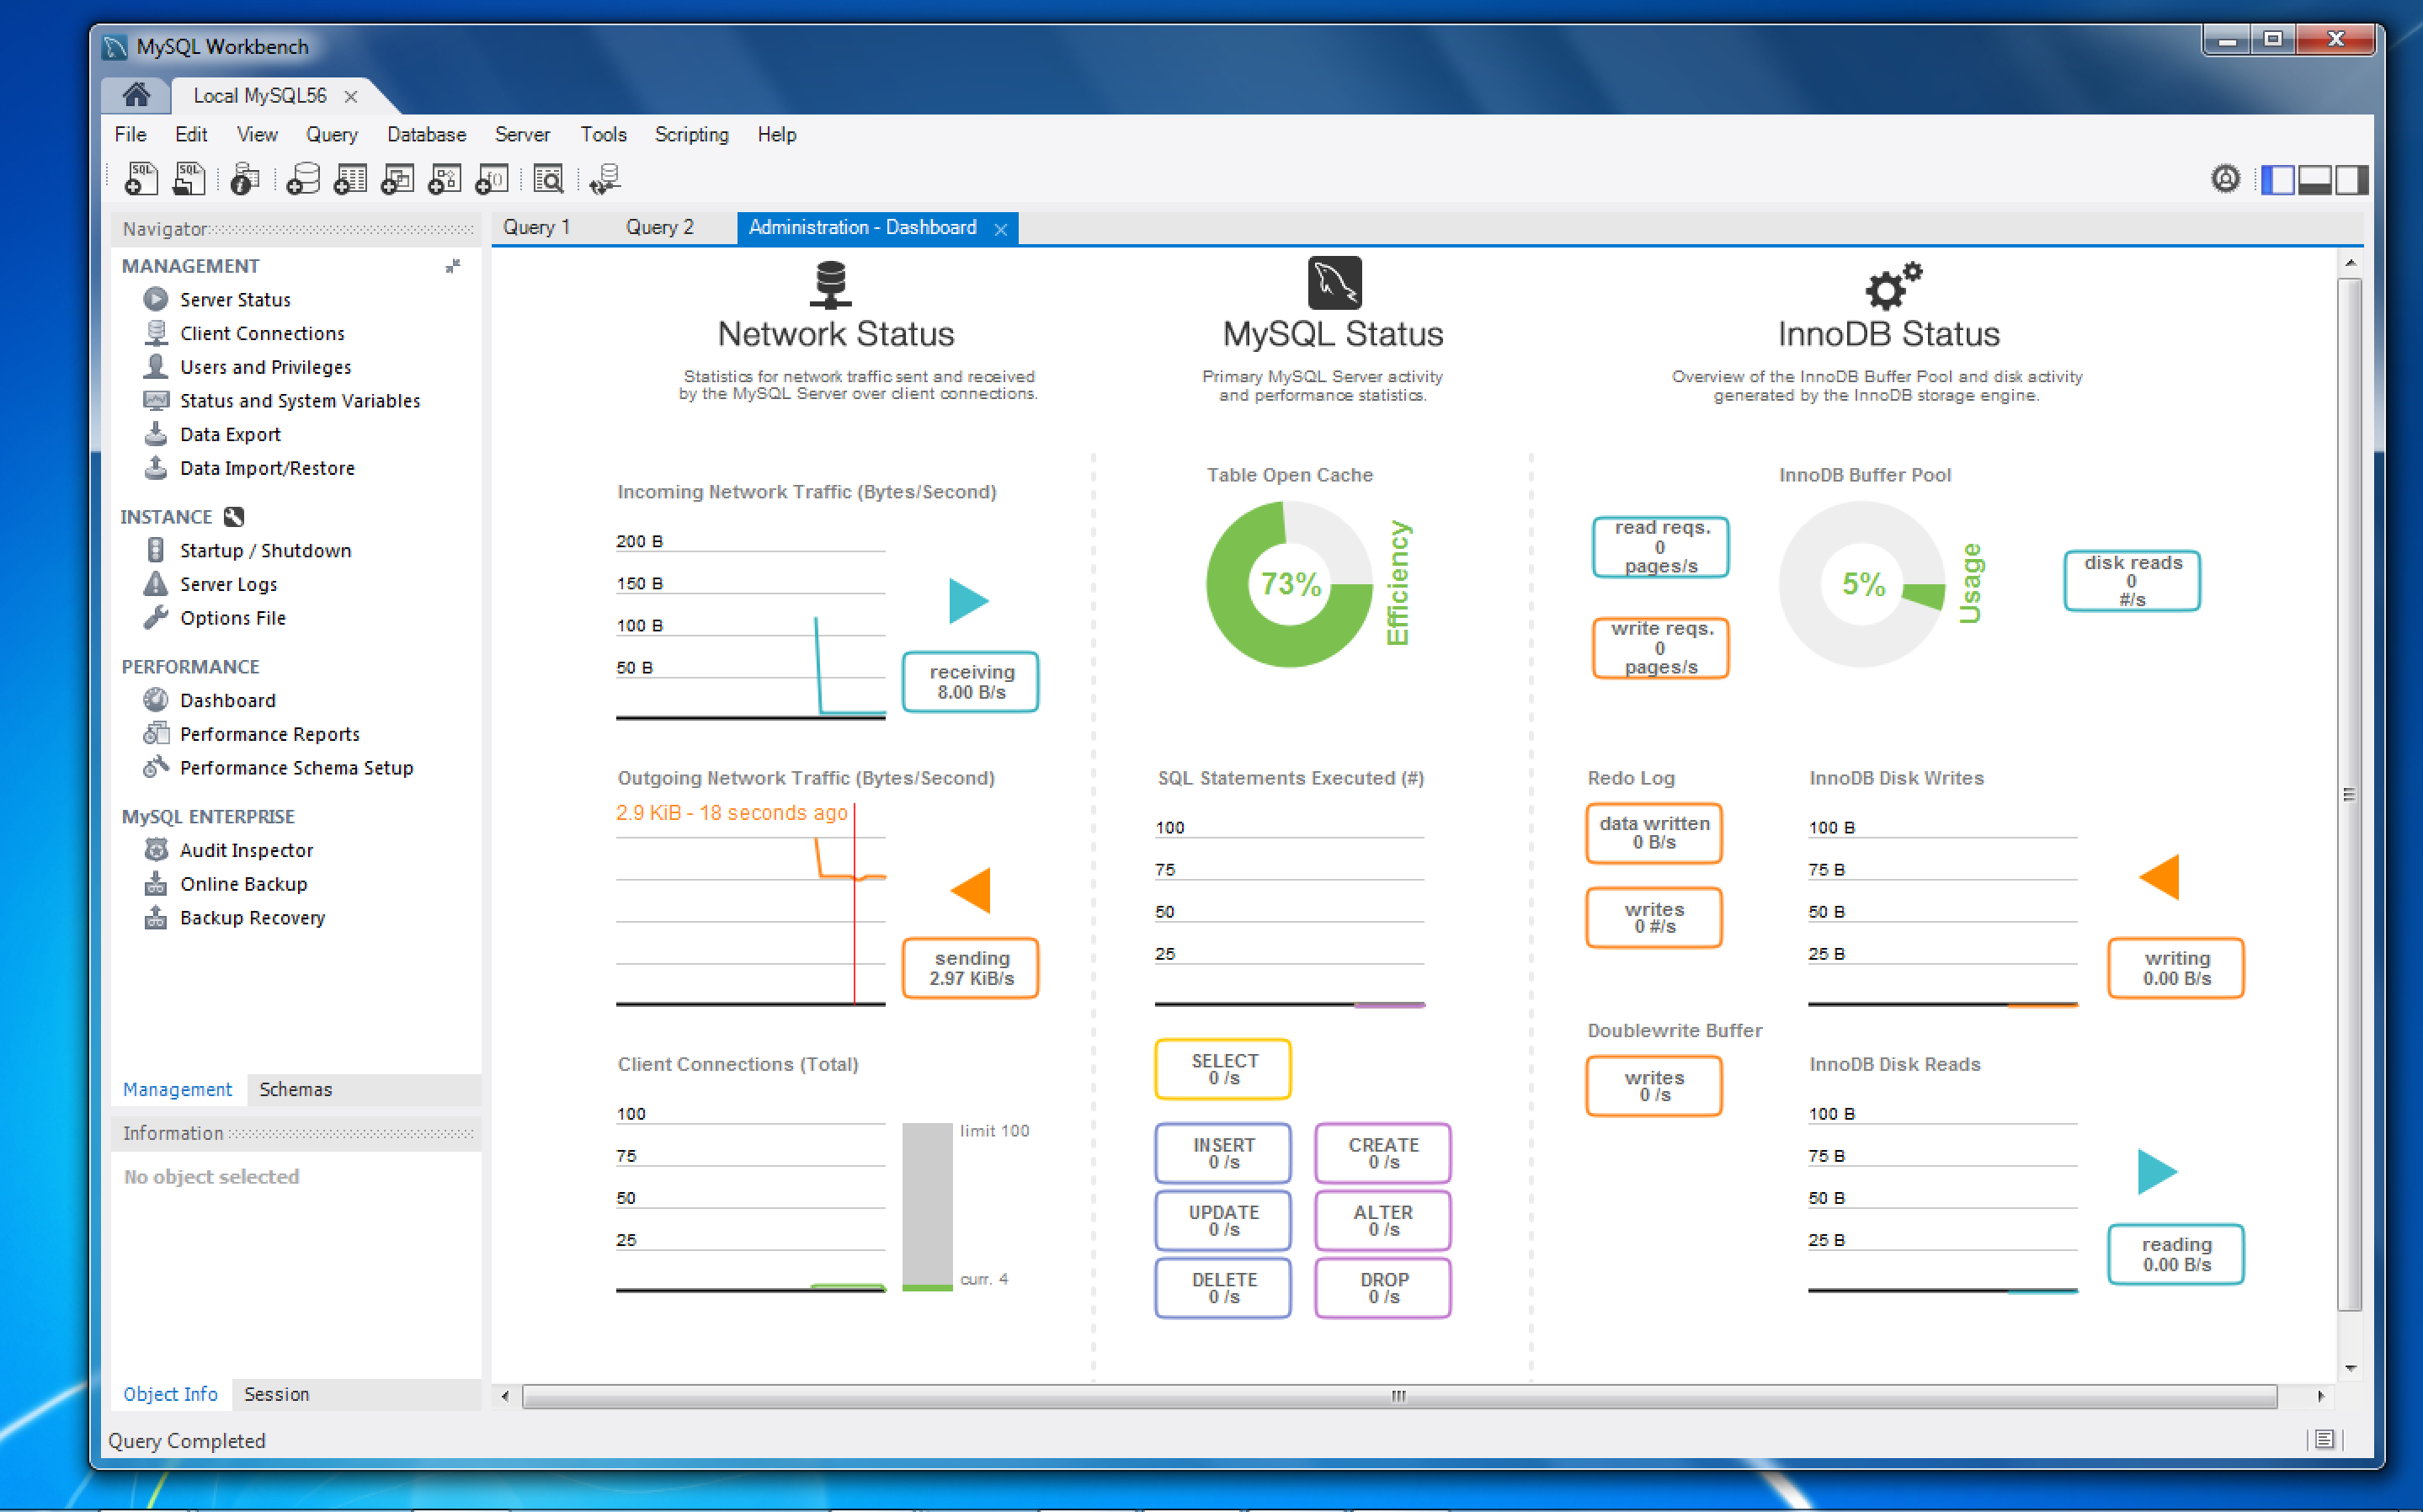
The Performance Dashboard provides quick "at a glance" views of MySQL performance on key server, network, and InnoDB metrics. Simply mouse over various graphs and visuals to get added details.
New! Performance Reports
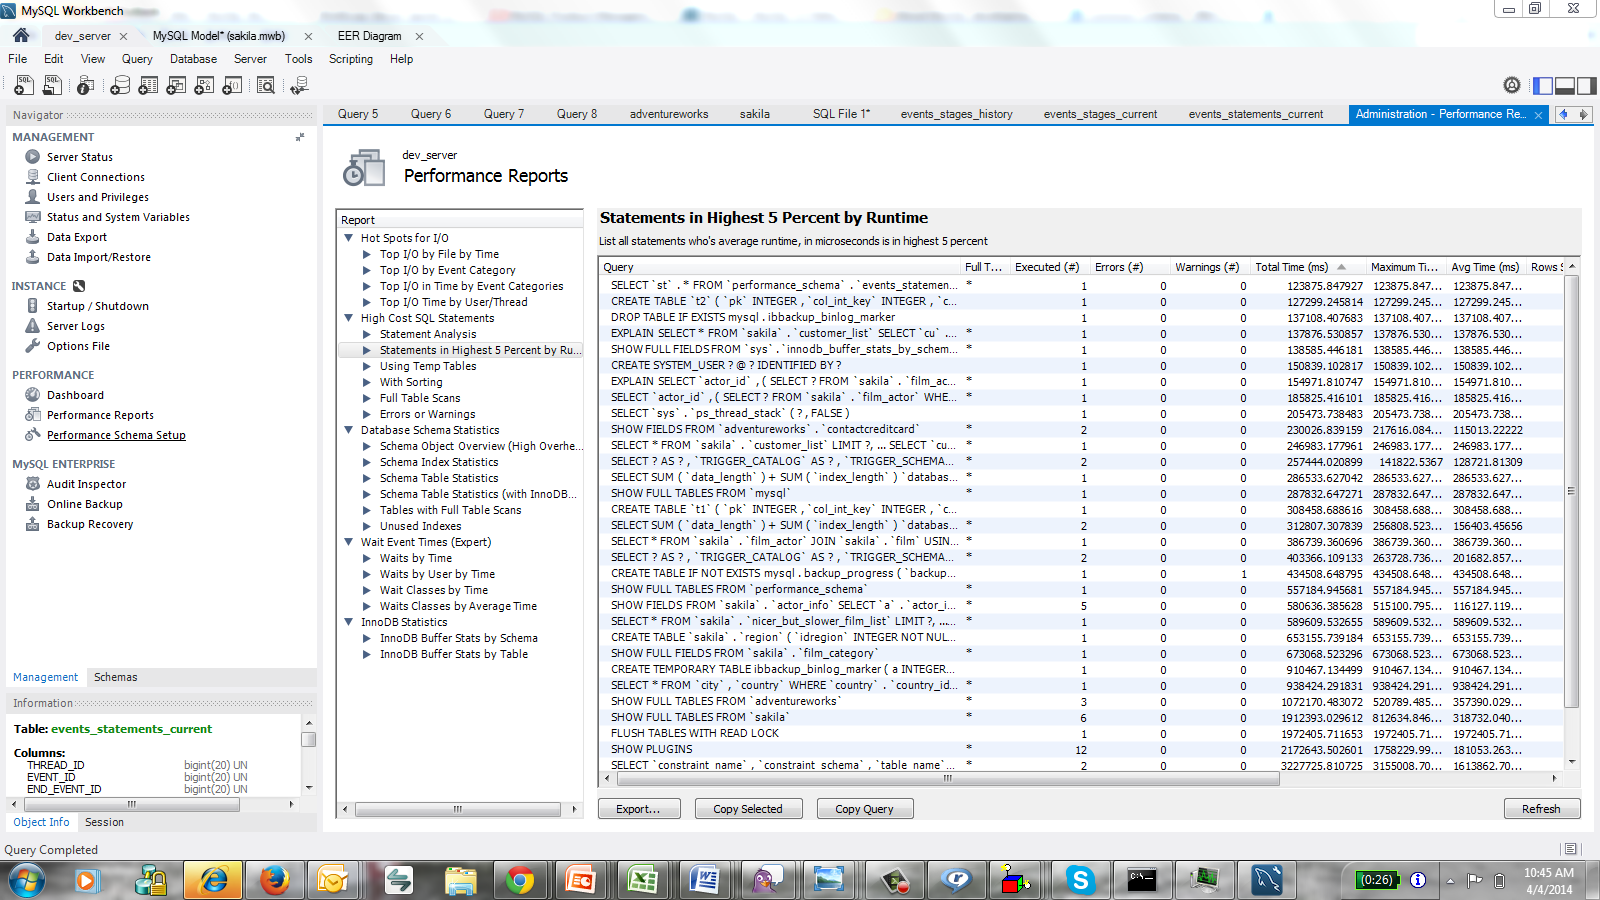
Over 20 reports help to analyze the performance of your MySQL databases. Targeted reports make analyzing IO hotspots, high cost SQL statements, Wait statistics, InnoDB engine metrics. MySQL Workbench leverages the SYS views on the Performance Schema.
New! Explain Plan
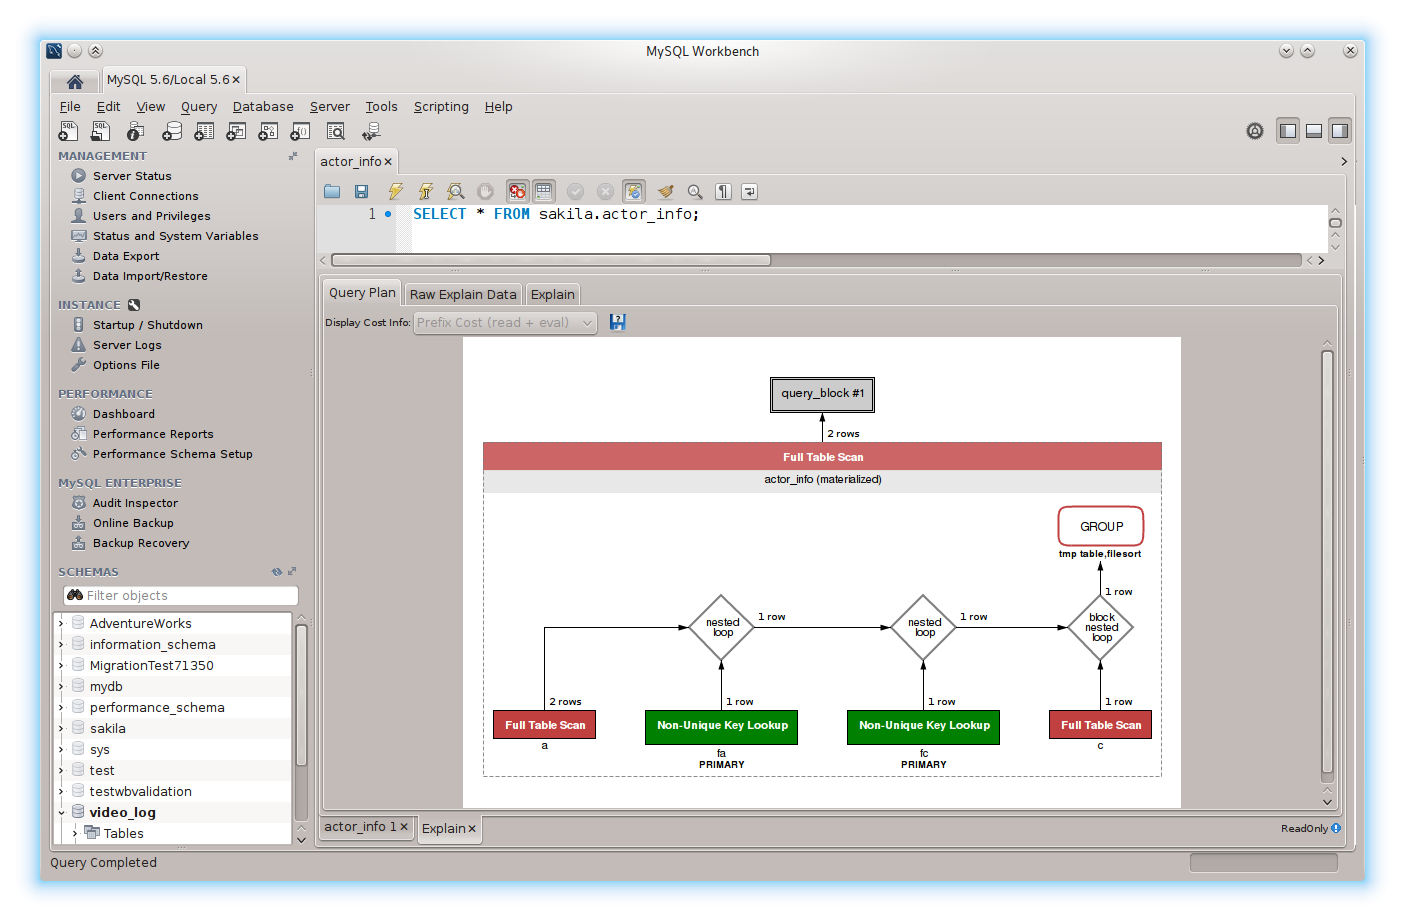
The explain plan shows the operations MySQL performs when it runs SQL statements. This information can help optimize SQL performance. MySQLWorkbench Visualize Explain plans graphically show and highlight how SQL statements execute within MySQL. By showing developers costs and tuning hints, MySQL Workbench improves and simplifies SQL statement performance tuning.
New! Query Statistics
Query Statistics provide instant statistics on SQL executed from the Workbench Editor, such as details about the fields in your result set and key performance statistics from your query, such as client timing, network latency, server execution timing, index usage, number of rows scanned, joins, use of temporary data storage, and more.


